


Speakers
This year’s speakers at the Visualizing Knowledge conference give an extensive view on the key concept “senses.” This theme delivered through their expertise – ranging from interactivity and behavior to the environment – guarantees exciting talks with compelling visualizations.
Joost
Grootens (NL)
Designer
Lisa
Charlotte
Rost (DE)
Designer & Blogger
Iiro P.
Jääskeläinen (FI)
Associate Professor, Department of Neuroscience and Biomedical Engineering
Christina
Franken (NL)
Smart Cities / Smart Buildings Expert
Juuso Koponen +
Jonatan Hildén (FI)
Information Designers
Jens
Finnäs (SE)
Founder of Newsworthy and J++ Stockholm
Antti
Tenetz (FI)
Regional Artist of Biological Arts
Kirell
Benzi (FR)
Creative Data Scientist
Essi
Huotari (FI)
Designer at Futurice
Karri-Pekka Laakso &
Edward Landtman (FI)
Lead Designers at Reaktor
Lightning
Talks
More matter, with less art
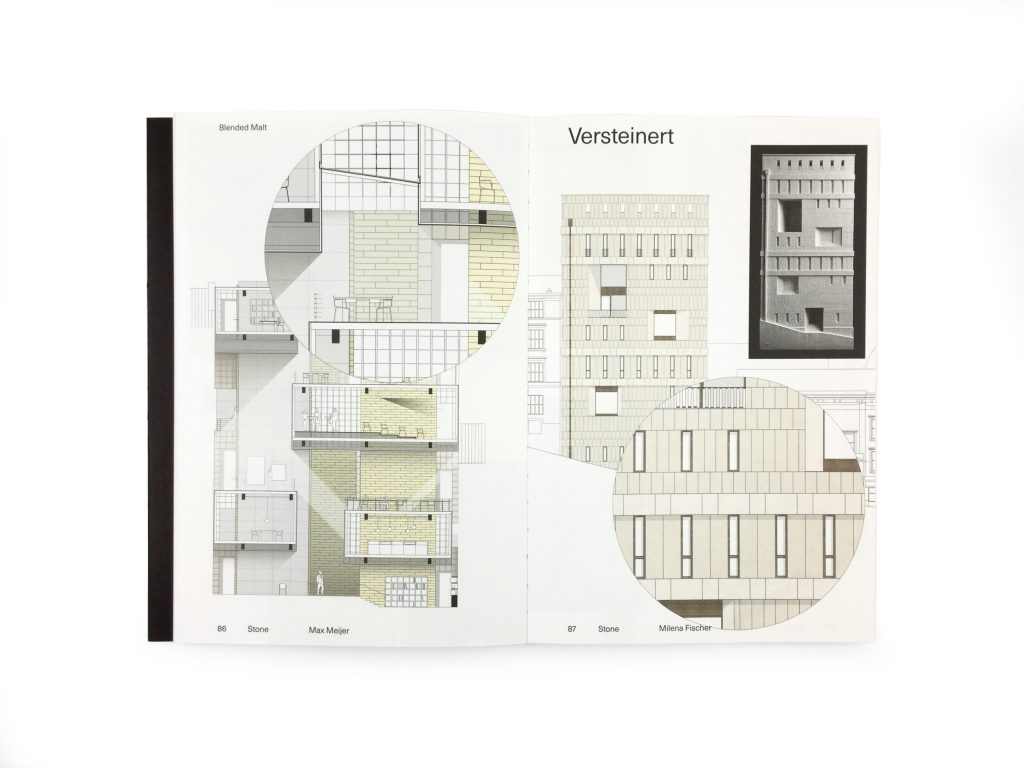
Joost Grootens is a graphic designer, researcher and educator. His studio SJG designs books, maps, typefaces, spatial installations and digital information environments. Grootens leads the master Information Design at Design Academy Eindhoven. Since 2015 he is PhD candidate at Leiden University. His research addresses the transformation of the fields and practices of graphic and map design resulting from technological changes in tools to record, create, edit, produce and distribute visual information.
A datapoint walks into a bar
Lisa Charlotte Rost is a Berlin-based designer & blogger at the charting tool Datawrapper. In 2016, Lisa was an OpenNews Fellow at NPR in Washington, DC. Before that, she created data visualizations for newsrooms like Tagesspiegel, Bloomberg, SPIEGEL & ZEIT Online. She co-hosts the Berlin Data Vis meetup, organizes the global, digital Data Vis Book Club and tries to spend less time on Twitter.
“tl;dr: Mother Teresa said "If I look at the mass I will never act. If I look at the one, I will." I'll present ways that make us act when looking at the mass.
Stories stick, but data doesn't. Stories stick because they make us feel something; and we remember situations in which we felt intense feelings. Stories make us act; they change our beliefs. Stories make us feel warm and empathic and alive. Data doesn't make us feel anything on it’s own. Data is cold.
And still, I love data, and I love to work with it. Can we create feelings with data? Away from the beaten paths of company dashboards, scientific plots and newspaper graphics? I believe it's possible. In my talk, I will showcase ways to present data so that it sticks and makes you feel things.”
Works:
Thoughts & How To's
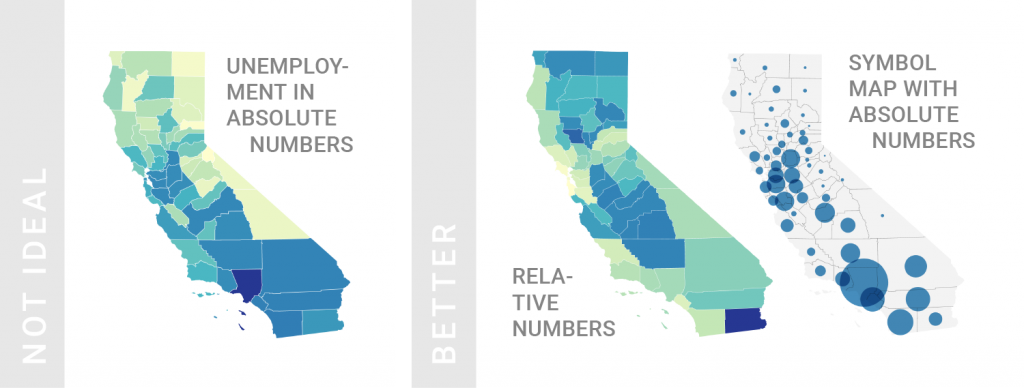
What to consider when creating choropleth maps
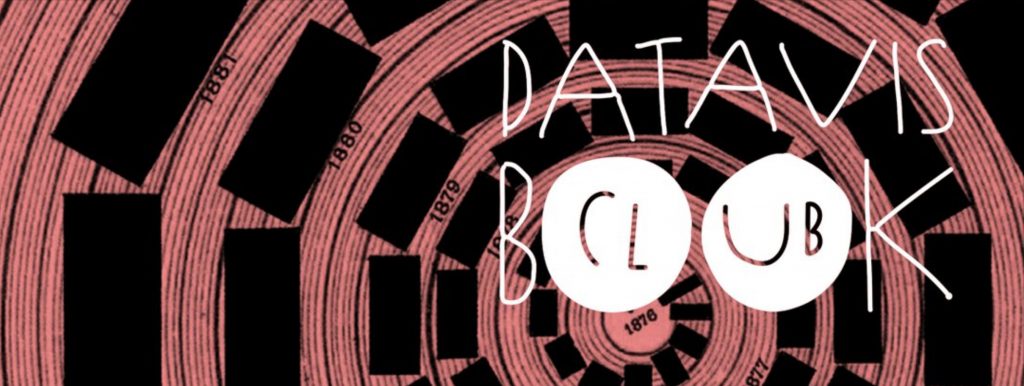
Data Vis Book Club
Flatland
Iiro P.
Jääskeläinen (FI)
Associate Professor, Department of Neuroscience and Biomedical Engineering
Movie Perception Brain Culture PersonalityIiro's Linkedin
Individual differences in how one's brain views the world
Iiro P. Jääskeläinen, Ph.D., is a cognitive neuroscientist who uses movies and narratives as naturalistic stimuli during neuroimaging to study perceptual, memory, social cognitive, and emotional processes, including how those are shaped by cultural background and psychological traits of subjects. Prof. Jääskeläinen defended his Ph.D. thesis in the University of Helsinki in 1995 after which he worked as post-doctoral researcher and junior faculty member at Harvard Medical School, Boston, MA before joining Helsinki University of Technology that subsequently was transformed into Aalto University.
Works:
A drama movie activates brains of holistic and analytical thinkers differentially
Christina
Franken (NL)
Smart Cities / Smart Buildings Expert
Data analytics Data science Data visualization User experience Smart citiesChristina's Twitter
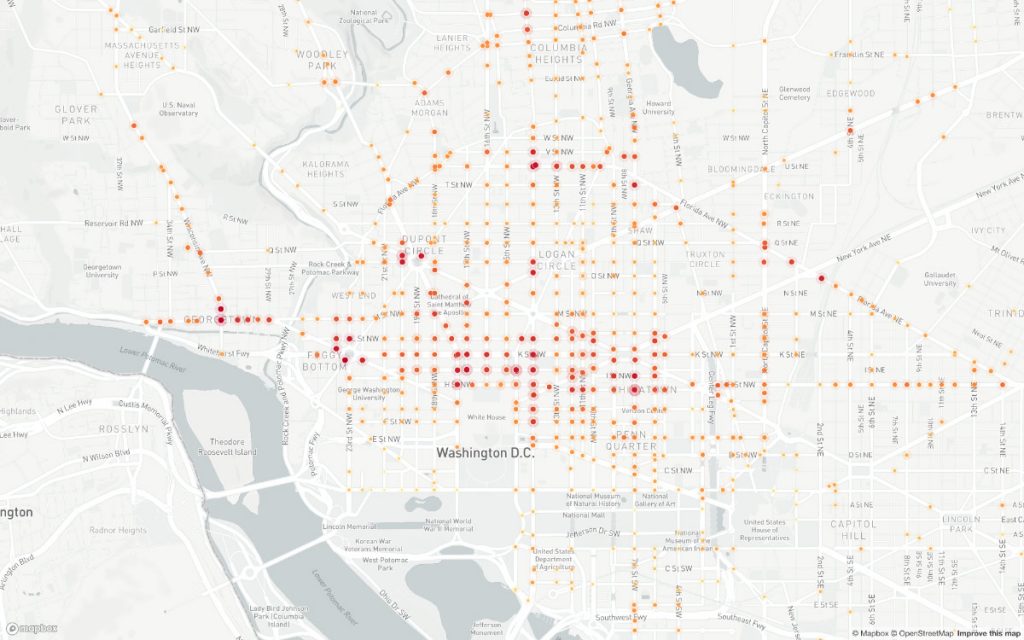
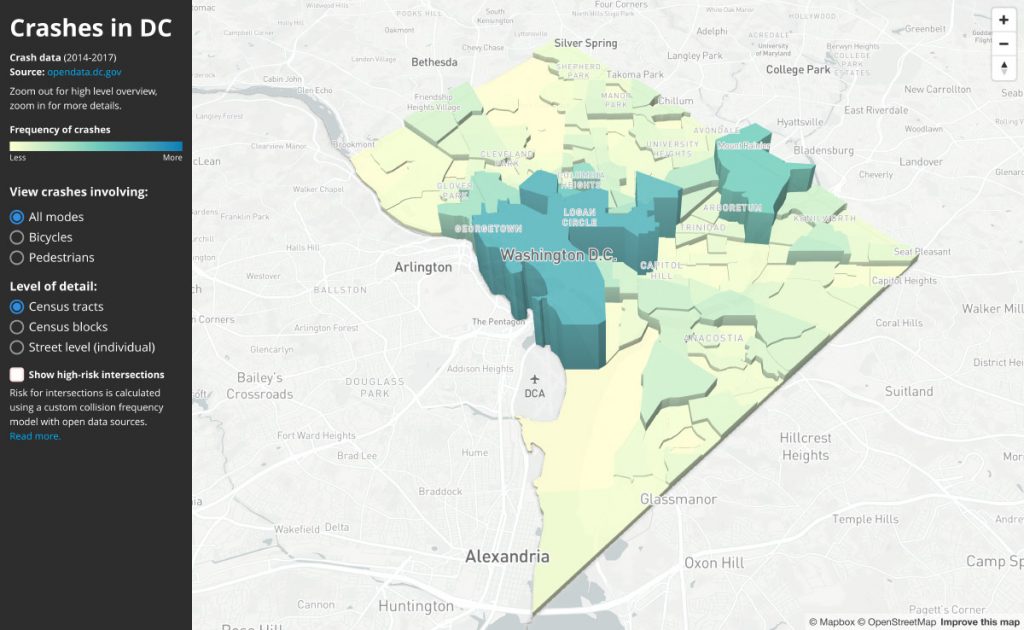
Data and its role for the built environment
Christina works at the intersection of urban tech, data analysis, and user psychology on data-heavy smart city and smart building projects. With a diverse background spanning from design and engineering to business strategy, she has been working at startups in Europe and the U.S.. Prior to working on a building intelligence tool at Lone Rooftop, she managed the Smart City program at Mapbox, with projects on mobility, traffic safety and disaster response. Previously, Christina explored what can motivate more people to be active in the urban environment at Human.co, where the team visualized data on human activity in 900 cities worldwide. Christina graduated from Karlsruhe Institute of Technology in Germany as an architect and holds a Master from Central Saint Martins London.
Works:
Visualising fatalities in Washington DC
Human Cities
Juuso
Koponen &
Jonatan
Hildén (FI)
Information Designers
Maps Cartography Atlas Project launchkoponen-hilden.fi
@koponenhilden
A new atlas of Finland
Juuso Koponen and Jonatan Hildén are the founders of Koponen+Hildén, a Helsinki-based information design studio. They are the authors of the books Tieto näkyväksi and Data visualization handbook, and teach information design at Aalto University and other Finnish universities.
Works:
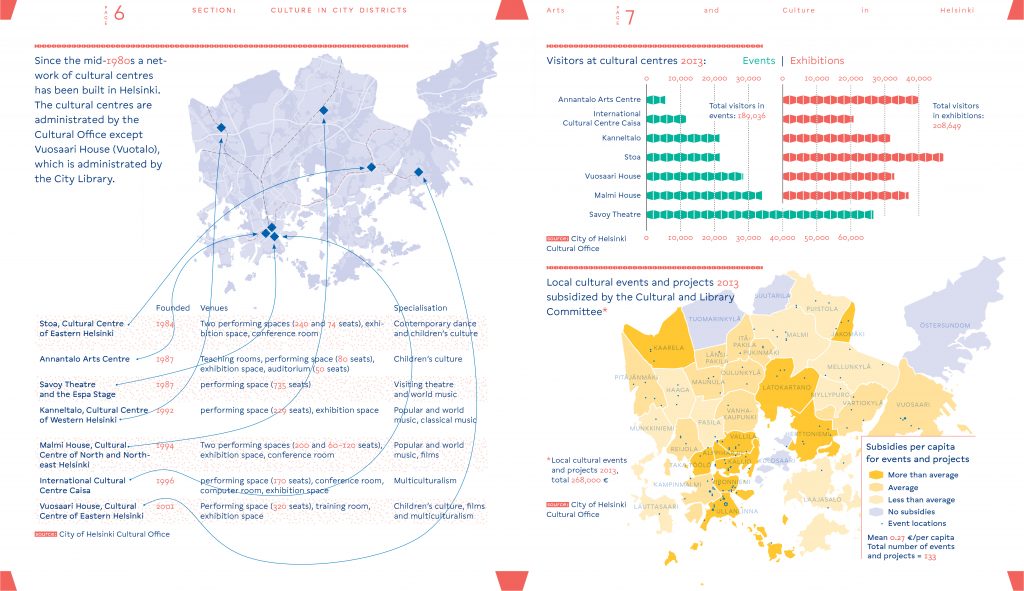
- Arts and Culture in Helsinki. A 58-page statistical publication created for City of Helsinki, which takes a data-driven approach to arts and culture in the Finnish capital. Collaborators: Tommi Kovala
- Naisjohtajat (Female Leaders) for Keksi and Finland Chamber of Commerce. An interactive visualization showing 365 Finnish female leaders and their stories, for a campaign trying to bring more women to the boardroom.
Jens
Finnäs (SE)
Founder of Newsworthy and J++ Stockholm
Data Journalism Automation Robot Journalism Text Generationnewsworthy.se
@jensfinnas
Automating journalism and visualizations – the HARD parts
Jens Finnäs is the founder of J++ Stockholm, a freelance agency dedicated to data-driven journalism and Newsworthy, a service for finding local news in data through automation. He has been a pioneer in data journalism in Scandinavia with ten years of experience from the field. In the last couple of years he has focus on newsroom automation or “robot journalism”. How can we use automation techniques for finding, telling and visualizing stories in data? Jens Finnäs is born in Finland, has studied at Helsinki University, but now lives in Sweden. J++ clients include many of the top Scandinavian newsrooms: Aftonbladet, Expressen, Sveriges Radio, TT and SvD in Sweden, Yle and HBL in Finland and NTB in Norway.
Works:
- A Newsworthy example from Sweden. We generate reports or articles about reported crime in more than 300 Swedish municipalities, counties and city districts across three different crime groups.
- A visualization for the magazine Ottar that was shortlisted for the international Data Journalism Award in 2018.
- A large investigation into climate change and temperature increases across Europe from 2018. Also an example of locally angles reports and visualizations.
Antti
Tenetz (FI)
Regional Artist of Biological Arts
Datavisualization Gpsart Locativemedia Crticaldesign Tacticalmedia Bioart Artscitenetz.com
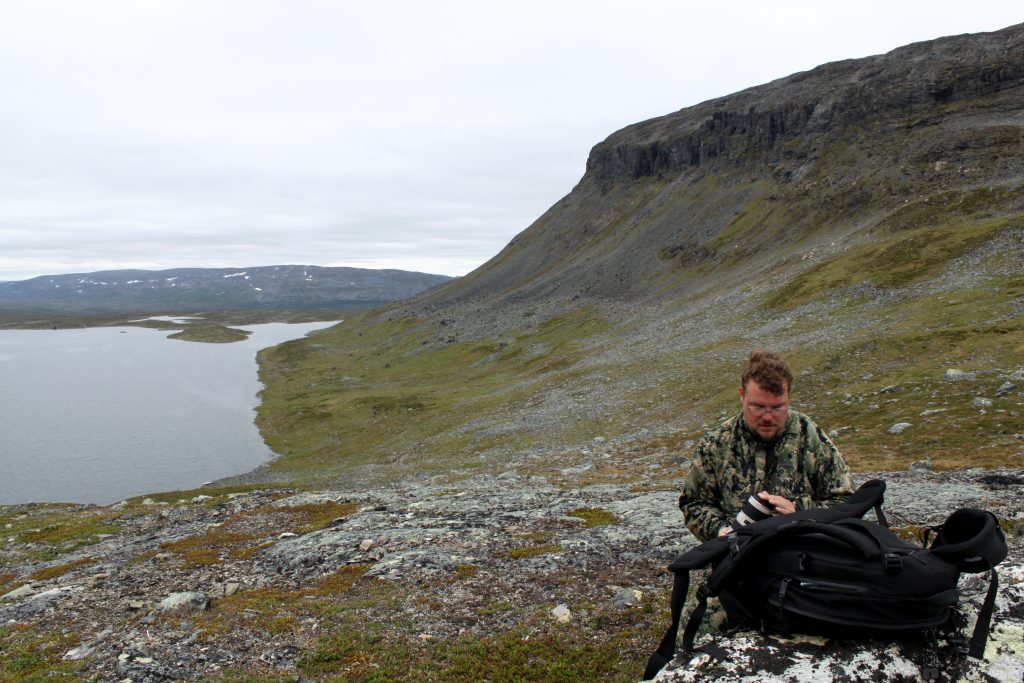
Beyond numbers – Foraging data and expanding horizon
Antti Tenetz is regional artist for bioart in Finnish Arts Promotion Center. He strenghten a nationwide art and science and bioart network and thereby increase international co-operation and increase the artists’ working conditions. Tenetz has been writing in international publications, done residencies and research positions, acted as evaluator and developer for Finnish art & science funding bodies, and more often he is invited expert for addressing future of arts and science and technology. Working interdisciplinary in his private art practice, his work often utilizes scientific methods in order to render natural and cultural phenomenons such as climatic change, environmental issues and biodiversity. Employing contemporary technologies such as drones, biotech and AI his work can border on surveillance, relationship with nature and tech, privacy, law, landscape and natural values as well as other species and the forming of our living space, respect and survival.
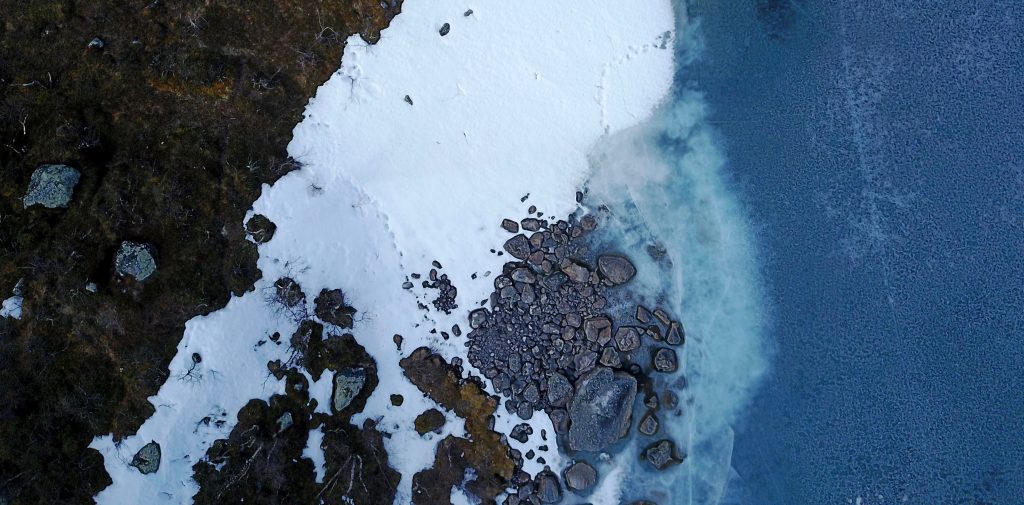
DCIM\106MEDIA\DJI_0153.JPG
Kirell
Benzi (FR)
Creative Data Scientist
Data art Data viz Data science Communicationkirellbenzi.com
@KirellBenzi
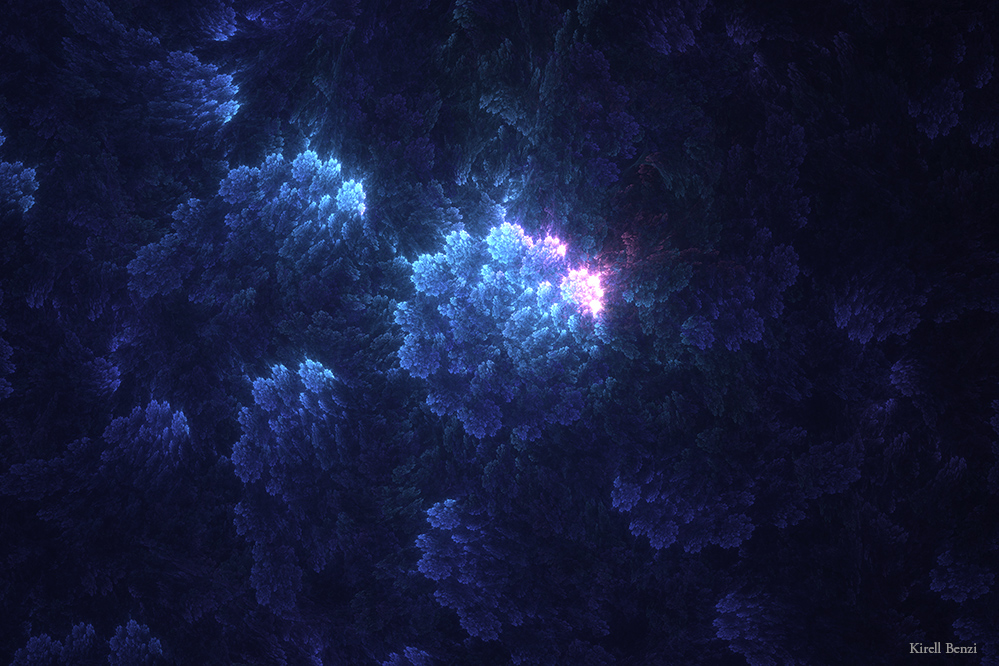
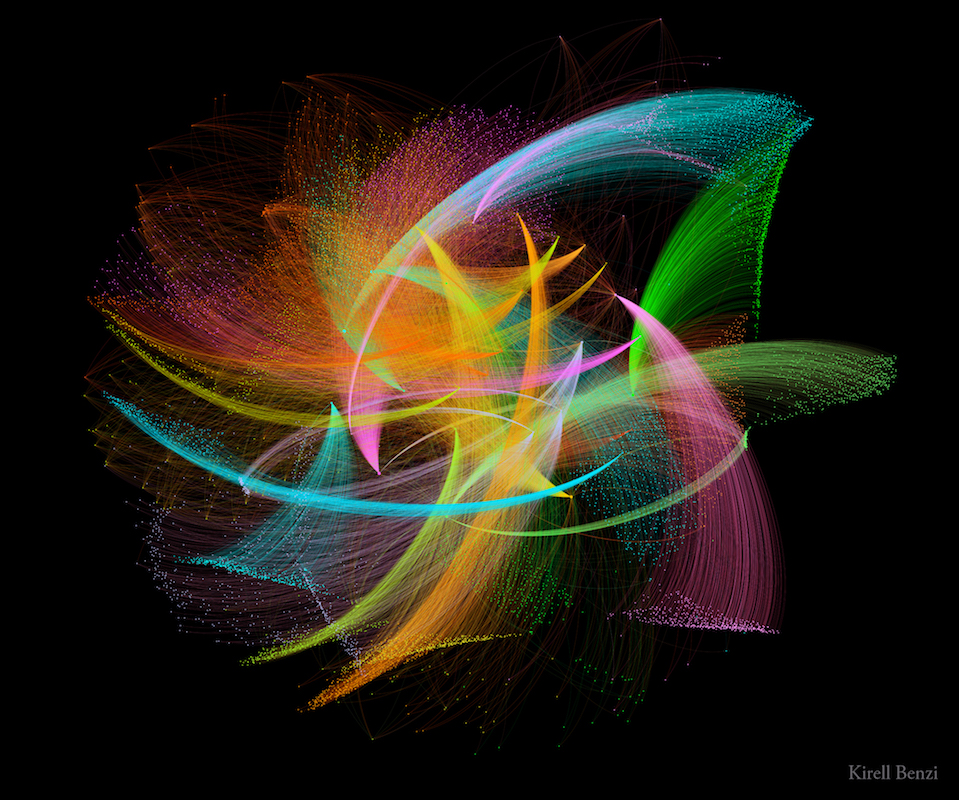
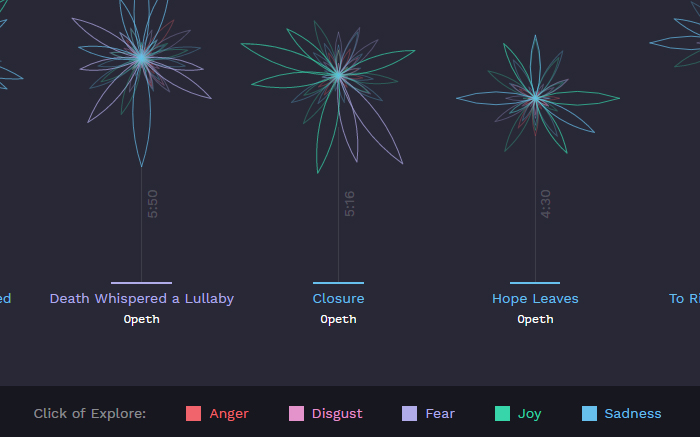
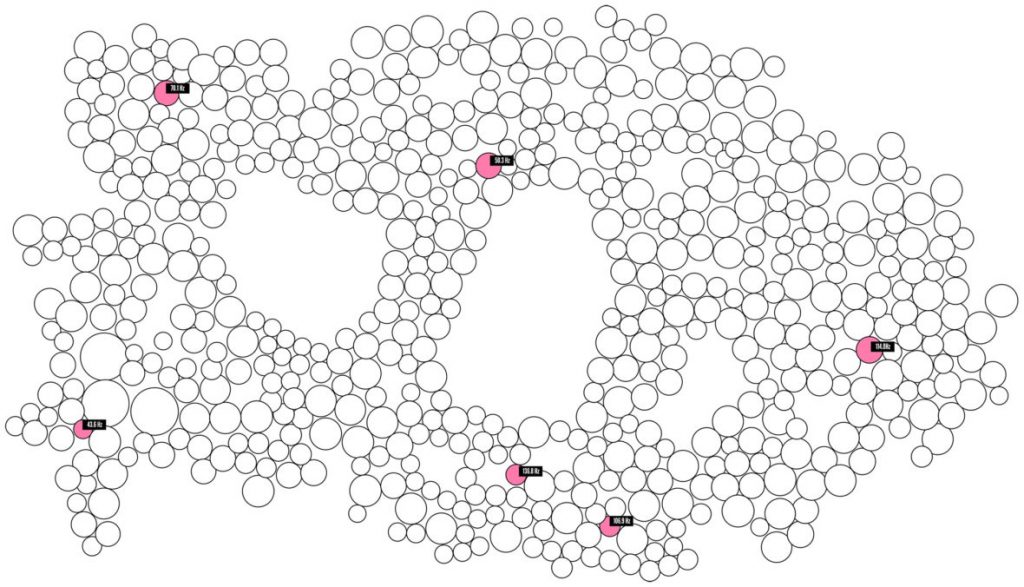
From data science to data art
Kirell Benzi is a data artist. He holds a Ph.D. in Data Science from EFPL (Ecole Polytechnique Fédérale de Lausanne) where he teaches data visualization to over 180 master’s students. In their whole, Kirell’s creations, can be articulated and deciphered following an array of tones, shapes, dots, and lines that are staged according to the nature of the data, by using mathematical tools and methods which come straight from scientific research. Through a hypnotic visual semantic, Kirell works to show that algorithms have a soul… In other words, that we can generate emotion and curiosity through calculations. Even though this logic can seem cold in the collective imagination, it might be able to seduce even the most averse to algebra.
Works:
Outside the Box
When the Music is Good
Deep Sea
Fires of Industry
Essi
Huotari (FI)
Designer at Futurice
data visualisation design process qualitative data democracy transparency@EssiHuotari
@futurice
futurice.com
Enhancing democracy through data & design
Essi Huotari is a designer at Futurice who works on society, data, social media and ethics related topics. Her recent work includes information design on international peace operations and service design for exposing political influencing in learned environments such as social media. She co-hosts Futurice’s AI ethics trainings.
Works:
Arms report
Effectiveness of Peace Operations vizualisation
Yle "Five million campaign ads" prototype
Karri-Pekka Laakso &
Edward Landtman (FI)
Lead Designers at Reaktor
interaction visual tools service designreaktor.com
The effortless airport: supporting personnel and passengers with real-time visualizations
Karri-Pekka Laakso is a lead designer, authority in interaction design, and an experienced university level teacher. He has specialized in making efficient, smooth and powerful software tools for professional use in domains like telecom, banking, education and medicine. He goes barefoot whenever it’s appropriate – and often even if it’s not – and practices backflips and orienteering in his free time.
Edward Landtman is a lead designer currently specialising in solving design problems in the aviation industry. The highly regulated industry has made him an expert in improving experiences where most variables are fixed. Whenever he can, he escapes the city in search for nature and minimal clutter in his life.
Works:
For Finavia: Transforming Helsinki Airport into the smartest airport in the world
John
Lee (KR)
Aalto University Media Lab Student
sound Visualization algorithm art generative artjohnlee012.com
Seeing sound listening to image
My name is John Lee and I have a passion to create a new system or art piece. I worked for more than 10 years for semiconductor & LCD industry as software developer. One day, by chance I encountered with a new media art installation. I was shocked at how the installation gives me an impression. Since that time, I studied new media art and general design from Art school. My interesting area is interactive art, sound visualization, and algorithmic drawing. For me, I think the design is an entire process of solving problems. From this point of view, everything seems like a design. Also, through design, many things become convenient and there were examples that design solved social problems.
VR-Viz: Visualization system for data visualization in VR
I am a Helsinki-based designer & data visualizer at Futurice. In 2018, I completed his master thesis in information design at Aalto university. My master thesis focused on examining data visualizations in virtual reality. Currently, I work in Futurice as designer, with main focus on projects related to visualization.

Matti
Niinimäki (FI)
Artist, Lecturer
sonification cultural heritage interactive installationmansteri.com
@mnstri
PMOS – Sonification of the Sibelius Monument
Matti Niinimäki is an artist, designer and lecturer based in Helsinki, Finland. He works mainly in the fields of interactive art, experimental electronics and real-time audio and video. Niinimäki also works as a Lecturer in New Media in the Aalto Media Lab in Aalto University.
Jarkko
Ryynänen (FI)
Project Manager
automated content creation politics robojournalismYle News Lab
@Ryynaja
Robojournalism and politics
I'm 42-year-old computer geek who loves computer games and scifi. I work as a project manager at Yle News Lab.
Recently I have been working with Yle's robo-journalist Voitto and vote compass and other politics related projects. I have over 10 years long experience in Vote compasses and little bit over 2 years of experience in automated content creation.
My mission is to design and build services that give people insights, help them learn new things and still be fun and easy to use.