


Workshops
Topi
Tjukanov
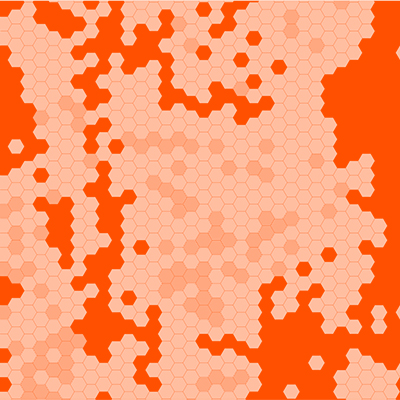
Creative mapmaking + experimental cartography with QGIS
Juuso
Koponen &
Jonatan
Hildén
Introduction to visualizing data with code
Antti
Tenetz
Foraging Nature Data: A Data collection walk in nature
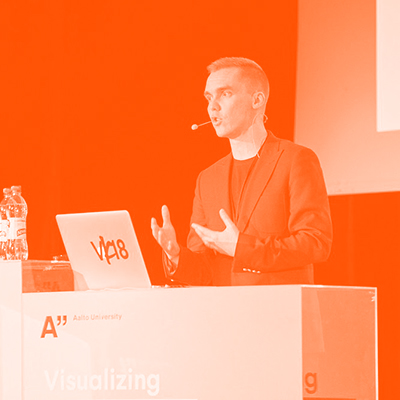
Topi
Tjukanov
GIS Consultant
Date: 8.5.2019
Time: 9—18
Venue: Dipoli, Palaver
Price: 200€, Students 35€
@tjukanov
Creative mapmaking + experimental cartography with QGIS
This fun workshop aims to showcase the possibilities of QGIS in data visualization. In a single day we go through basics of working with geospatial data and for example combining it with tabular data and basic ways you can integrate QGIS in to your workflow, whether you are a graphic designer, developer or just a person who wants to make maps. Workshop aims to give participants the basic ability to work with QGIS, but also take a closer look on how to produce visually appealing maps and/or other geospatial visualizations, like cartograms, animations on weird data-art experiments. QGIS is an excellent free and open-source cross-platform desktop geographic information system (GIS) application that supports viewing, editing, and analysis of geospatial data. No prior experience in QGIS is required.

Juuso
Koponen &
Jonatan
Hildén
Information Designers
Date: 9.5.2019
Time: 9—16
Venue: Dipoli, Palaver
Price: 150€, Students 35€
@koponenhilden
Introduction to visualizing data with code
Code is a powerful tool for data visualization but learning programming skills can seem daunting to people with non-technical background, such as designers, journalists, and communicators. This workshop is an easy first step for the complete beginner on the way to learning to code.
The practical part of the workshop will consist of three steps: preparing data for use, reading the data in and analyzing it, and creating simple visualizations based on it. We will work with the Python language, which is easy to learn, and has powerful capabilities for both processing and visualizing data. It is also somewhat similar in syntax to Javascript, which makes learning Python a good first step on the way for learning to create interactive visualizations using D3.js or other Javascript libraries.

Antti
Tenetz
Artist
Date: 8.5.2019
Time: 9—16
Venue: Design Factory, Studio
Price: 150€, Students 35€
Foraging nature data: A data collection walk in nature
Expanding the idea of data collection from your surrounding environment and beyond our surroundings. Discussing and exploring nearby surroundings, shore line, spaces between nature and technology and collecting samples and mapping them.
Data collection through USB Microscope, Drone, Mobile Phone.